“Big data” is a hot topic not only in marketing, but also in business because of the potential it offers in helping to make smarter, more efficient decisions. At Responsory, we’ve been using data analytics for years to boost campaign results. We frequently work with our clients to help them use their data to better understand and target their audiences.
For example, predictive modeling is a proven technology that has been used for decades by many large retail and financial institutions to improve audience targeting for customer acquisition and cross-selling. One of the challenges with traditional analytics and modeling processes is they typically involve weeks of analysis, expensive tools and high levels of statistical expertise.
At Responsory, we use an automated solution for analytics that speeds up the process to make it practical for just about any marketing campaign. Instead of spending weeks on the analysis process, we usually can complete it in a matter of days. By statistically identifying what is unique about existing customers, responders or donors when compared to the general population, we can uncover strong cues that indicate who the best prospects will be for future campaigns.
In one recent campaign for a nonprofit, we generated a healthy 1.6% response rate from prospects who became new donors by profiling and modeling the organization’s existing donor list.
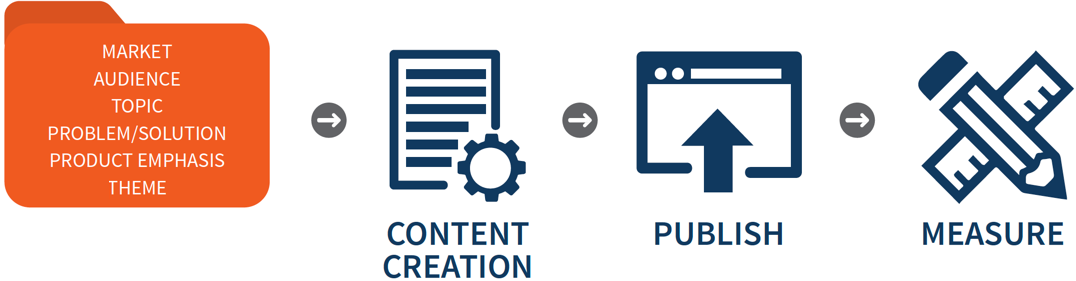
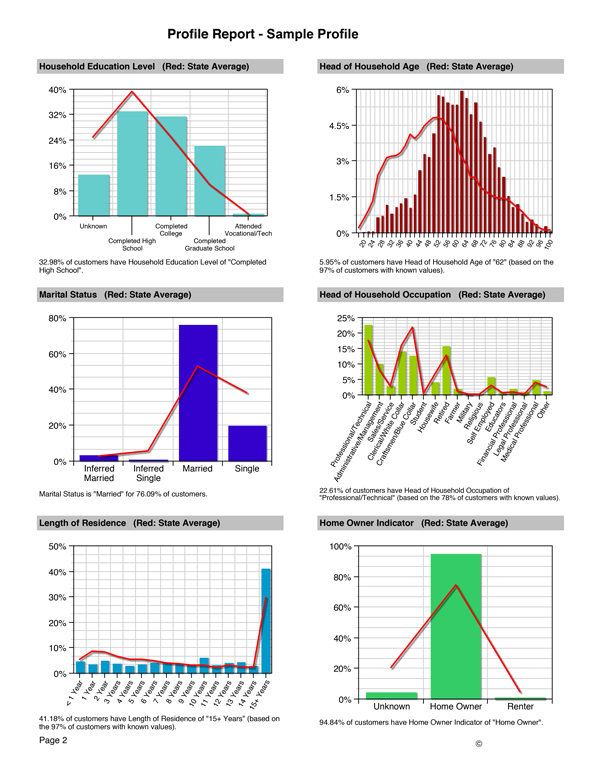
Two key analytics reporting tools we generate include: Profile Reports and Model Reports. Profile Reports provide a snapshot of the audience by identifying common characteristics such as age, gender, affluence, geography, propensity to donate, interests and more. They provide helpful insight for audience segmenting and creative development. Model Reports are predictive and provide information about attributes that will signal behavior such as a response or donation.
Model Reports are created by analyzing hundreds of variables that can be attributed to those in your file with a patented automated process that uses genetic algorithms to create a scoring formula. They include a lift chart that illustrates how much more likely it is that model prospects will respond, along with a graphical summary of the attributes and/or behaviors that signal response and contribute to the model. The model itself is not delivered, but resides in a system as a resource for generating lists, so there are no confusing algorithms to decipher.
The availability of information today can be intimidating and overwhelming, but if you have the tools to process and understand it, it can be exciting and extremely beneficial. It can provide insight that helps to better allocate budgets and increase ROI. If you’re interested in learning more about how you can maximize your data, download our FREE guide to data analytics.